Impact of the dominant large-scale teleconnections on winter temperature variability over East Asia


Abstract

[1] Monthly mean geopotential height for the past 33 DJF seasons archived in Modern Era Retrospective analysis for Research and Applications reanalysis is decomposed into the large-scale teleconnection patterns to explain their impacts on winter temperature variability over East Asia. Following Arctic Oscillation (AO) that explains the largest variance, East Atlantic/West Russia (EA/WR), West Pacific (WP) and El Niño–Southern Oscillation (ENSO) are identified as the first four leading modes that significantly explain East Asian winter temperature variation. While the northern part of East Asia north of 50°N is prevailed by AO and EA/WR impacts, temperature in the midlatitudes (30°N–50°N), which include Mongolia, northeastern China, Shandong area, Korea, and Japan, is influenced by combined effect of the four leading teleconnections. ENSO impact on average over 33 winters is relatively weaker than the impact of the other three teleconnections. WP impact, which has received less attention than ENSO in earlier studies, characterizes winter temperatures over Korea, Japan, and central to southern China region south of 30°N mainly by advective process from the Pacific. Upper level wave activity fluxes reveal that, for the AO case, the height and circulation anomalies affecting midlatitude East Asian winter temperature is mainly located at higher latitudes north of East Asia. Distribution of the fluxes also explains that the stationary wave train associated with EA/WR propagates southeastward from the western Russia, affecting the East Asian winter temperature. Investigation on the impact of each teleconnection for the selected years reveals that the most dominant teleconnection over East Asia is not the same at all years, indicating a great deal of interannual variability. Comparison in temperature anomaly distributions between observation and temperature anomaly constructed using the combined effect of four leading teleconnections clearly show a reasonable consistency between them, demonstrating that the seasonal winter temperature distributions over East Asia are substantially explained by these four large-scale circulation impacts.

Understanding Teleconnections and Global weather patterns is becoming a key player in understanding anomalies during winter, the following from the Journal of Geophysics Research goes on to explain the “Connections”.

Go Ahead click the link.. you know you want to.

Cosmic Ray Induced Cloud Cover

There has been many papers over the years suggesting a strong link with Galactic Cosmic Rays and low level cloud cover resulting in a “cooling” effect of Earth, Cosmic rays are atomic nuclei: most are hydrogen nuclei, some are helium nuclei, and the rest heavier elements. Although many of the low energy cosmic rays come from our Sun, the origins of the highest energy cosmic rays remains unknown and a topic of much research, Most scientists suspect their origins are related to supernovas (star explosions).

Cosmic rays arrive with a variety of energies.  At the lowest energies, cosmic radiation is very common.  These particles originate from sources close to Earth such as the Sun.  We are shielded from most of the low energy particles by their interaction with the Earth’s atmosphere and magnetic field. The basic unit of measurement used in discussing the energy of a cosmic ray is the electron volt,  (eV.)  One eV is the amount of energy gained by a single electron when passing through an electric potential of one volt.  Common batteries (such as a D-cell) have a potential of 1.5 volts, so a single electron through a regular battery will gain 1.5 eV. 

As the energy of the cosmic rays increases, the frequency of the particles decreases steeply.  On arrival at the Earth, their path experiences less bending in the magnetic field and they penetrate deeper into the atmosphere.  Particles with intermediate energy levels, around what is called the “Knee” of the spectrum, are called Very High Energy cosmic rays and they occur with a frequency of one per square meter per year.  For the highest energy cosmic rays, above 1016 eV or what is called the “Ankle,” the rate of events falls to one per square kilometer per century.

The leading candidates for the source of Ultra High Energy cosmic rays are large, energetic structures where strong shocks are expected to be found. The most well known of these are supernova remnants, which have long been suspected to generate cosmic rays. Still, it is difficult to explain the existence of cosmic rays above 1016 eV, because supernovae are simply not large enough to maintain acceleration for Ultra High Energy particles.  Scientists suspect other large structures such as active galactic nuclei or colliding galaxies might be candidate objects which produce or accelerate these cosmic rays.

Here i provide  link to a very interesting paper published in the Astronomy and Geophysics published in the year 2000

Follow the link, you know you want to.


A Changing Polar Vortex

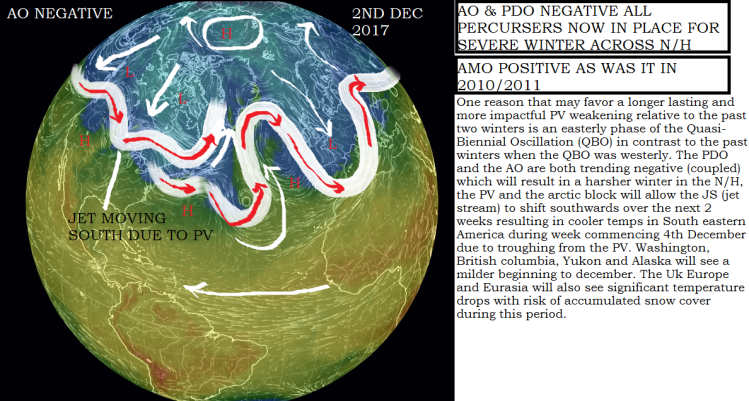
Over the past few years, the polar Vortex has been shifting but that doesn’t mean the Northern Hemisphere is going to be experiencing a milder winters. The polar vortex is shifting, and it’s going to make winters on the east coast of the US and parts of Europe even longer, with exceptionally cold temperatures expected during March.

The polar vortex is a zone of cold air that swirls around the Arctic during winter. When parts of the vortex break apart (weakens), it can cause unseasonably cold conditions in late-winter and early-spring in the Northern Hemisphere. This happened in early 2014 and caused an extreme weather event in the northern US and Canada.

Not many people realise there are actually two polar vortices: the stratospheric polar vortex, which is about 19,800 metres (65,000 feet) above the surface of the Earth; and the tropospheric polar vortex around 5,500 to 9,100 metres (18,000 to 30,000 feet) above the surface. Usually, when the weather forecasters are talking about the polar vortex, they’re referring to the tropospheric vortex, which is the one that rips apart and plunges cold air towards mid-latitude cities, such as New York. The stratospheric polar vortex, can have a bigger, but more subtle effect on mid-latitude weather.

The stratospheric polar vortex has gradually been moving towards the Eurasian continent, and getting weaker over the past 30 years. That might sound like a good thing for warm weather lovers, but a weaker polar vortex means a vortex that’s more likely to break, and those breakages are what send unseasonably late winter blasts of cold air down to the rest of the world. When the polar vortex is strong, on the other hand, all that cold air gets contained nicely in the Arctic circle where it traditionally is at that time of year. The weakening of the polar vortex isn’t necessarily new, it’s something several studies have shown over recent years. But this study also shows that the vortex is moving away from North America and towards Europe and Asia during February each year, and that could cause the east coast of the US to get even colder.

The meteorology is complicated, but the study says this shift tends to result in more of a dip in the jet stream over the east coast during February/March, which leads to colder temperatures, studies also found that this vortex shift is “closely related to shrinking sea ice coverage in the Arctic, particularly in the Barents-Kara seas, and increased snow cover over the Eurasian continent. But that link is still a little tenuous, The main issue here is that researchers have found a correlation, but no one has been able to show exactly how melting ice in the Arctic sea is causing the polar vortex to shift. The problem with most if not all of the Arctic/jet stream studies has been the lack of a clear physical cause and effect relationship, with correlations found but mechanisms as yet uncovered, However the consequences will still remain throughout Winters coupled with less solar irradiance and the ever increasing influx of Cosmic Rays, cooling Sea surface temperatures in 2016/17 and sun spots a rarity during cycle 24/25 Earth could be heading into temperatures similar to that of the maunder minimum of 1647-1715, a key component indeed will be the progression of solar cycle 25, so we have a decade at most to evaluate our current status and change the mindsets of CO2 induced climate change.

Watch this space for topical updates throughout cycle 25.

Understanding Weather Maps

We all tune into the Weather stations to see if we get to wear vests and shorts or a big woolly jumper, but when we look at the maps do we really understand the “Jargon”?, my latest venture attempts to break down barriers or the Divide between the public and the Tabloid news & TV.

The presentation is a fun way of learning please take a look all feedback would be greatly appreciated.

https://prezi.com/view/DBMNCDsXg8O0o1vd50aR/

Parker solar probe

The sun’s searing heat has made a mission into the star’s atmosphere impossible until now.The surface of the sun is 10,000°F, but its outer atmosphere—the corona—soars to some 3.5 million degrees Fahrenheit.

“This temperature inversion is a big mystery that no one has been able to explain,” says Nicola Fox, project scientist for the Parker Solar Probe, the NASA mission that aims to finally get close to the sun.

NASA announced that for the first time in its history, a spacecraft is being formally named after a living person—previously known as Solar Probe Plus, the Parker Solar Probe was renamed for Eugene Parker, the astrophysicist who discovered solar wind in 1958.

The mission is made possible by a shield constructed from a carbon-carbon composite, which will keep the probe’s instruments safe in the 70-degree range. Launching as early as July/August, 2018, the probe will make 24 orbits of the sun. It will get within four million miles of the star with the gravitational assist of seven Venus flybys.

parker

That’s close enough to find answers to the sun’s other big mystery: what creates the solar wind, the charged particles that accelerate from the sun and wreak havoc on Earth’s electrical systems.

Will this be a key in understanding climate connections to solar activity? indeed if the Parker Probe finds strong correlations to the connection of the Sun/Earth weather and climate connections, a massive debunk of a climate being driven by a trace gas as CO2 may be well established.

Winter 2017/18

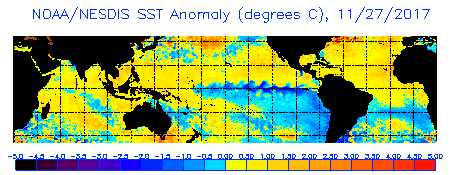
After following patterns of the PDO (Pacific Decadal Oscillation)  the AO (Arctic Oscillation) and the ever present AMO (Atlantic Multidecadal oscillation) it is noticeable that there is a positive feedback occurring, although the PDO has shown to be a slow formation November seen the SST around the North east coast of the Pacific cooling significantly,

anomnight.current.small

There Arctic Oscillation is also leaning towards a negative trend enabling troughs of cold arctic air to negate southwards, the Uk and Europe are already feeling the effects of this northerly blast with temperatures plummeting  during and throughout November, this Polar Vortex southerly drift will carry through to March/April bringing significant frost and snowfall to the UK, Southern/Central USA, Norway Sweden,Denmark, Russia, and Europe.

AO NOW

The El Nino Southern Oscillation is forming into La Nina 3.4 and is currently at watch status, however the consensus is that indeed La Nina will develop late November early December, as all the precursors are now in “Active” stage with all the feedbacks required; winter of 2017 has developed significantly early with record Snowfall and sub zero temperatures being achieved in the Northern Hemisphere, flooding in the Southern Hemisphere will result in crop losses, drought will be a factor in Indonesia, India, parts of Australia and south east Europe.

Several areas of seismic and Volcanic activity need to also be considered in the North Pacific Basin, (Aleutian Islands) Turkey Iran and Iraq and of course Indonesia (Bali), and the swedish borders.

In closing this could be a winter that people perish due to freezing temperatures reductions in nutrition as the transport network will be severely affected young children and the elderly will be affected the most, common sense prevails and travel should only be undertaken if it is absolute necessity,